Project
EIKON
Eikon is a set of software products provided by Thomson Reuters for financial professionals to monitor and analyse financial information. It provides access to real-time global pricing data (stocks and bonds), company fundamentals, I/B/E/S estimates, ESG data, deals and league tables, analyst reports, and more.
Eikon was withdrawn from LSEG’s product line on 30th June 2025
Industry
Fintech/finance
Year
2013/14
Challenge
Create and deliver visual solutions and design artefacts across desktop, tablet, and mobile platforms for Thomson Reuters Markets digital products, with a particular focus on Eikon, the globally recognised finance application that never seemed to run out of data.
Work as part of the UX Design and Engineering team and collaborate in multidisciplinary research, analysis and strategies to provide design solutions for Thomson Reuters digital products in line with the user and business needs.
Deliver high-fidelity mockups and assist with UX research on user testing interviews to collect information on user experience feedback to validate and calibrate design decisions.
Solutions
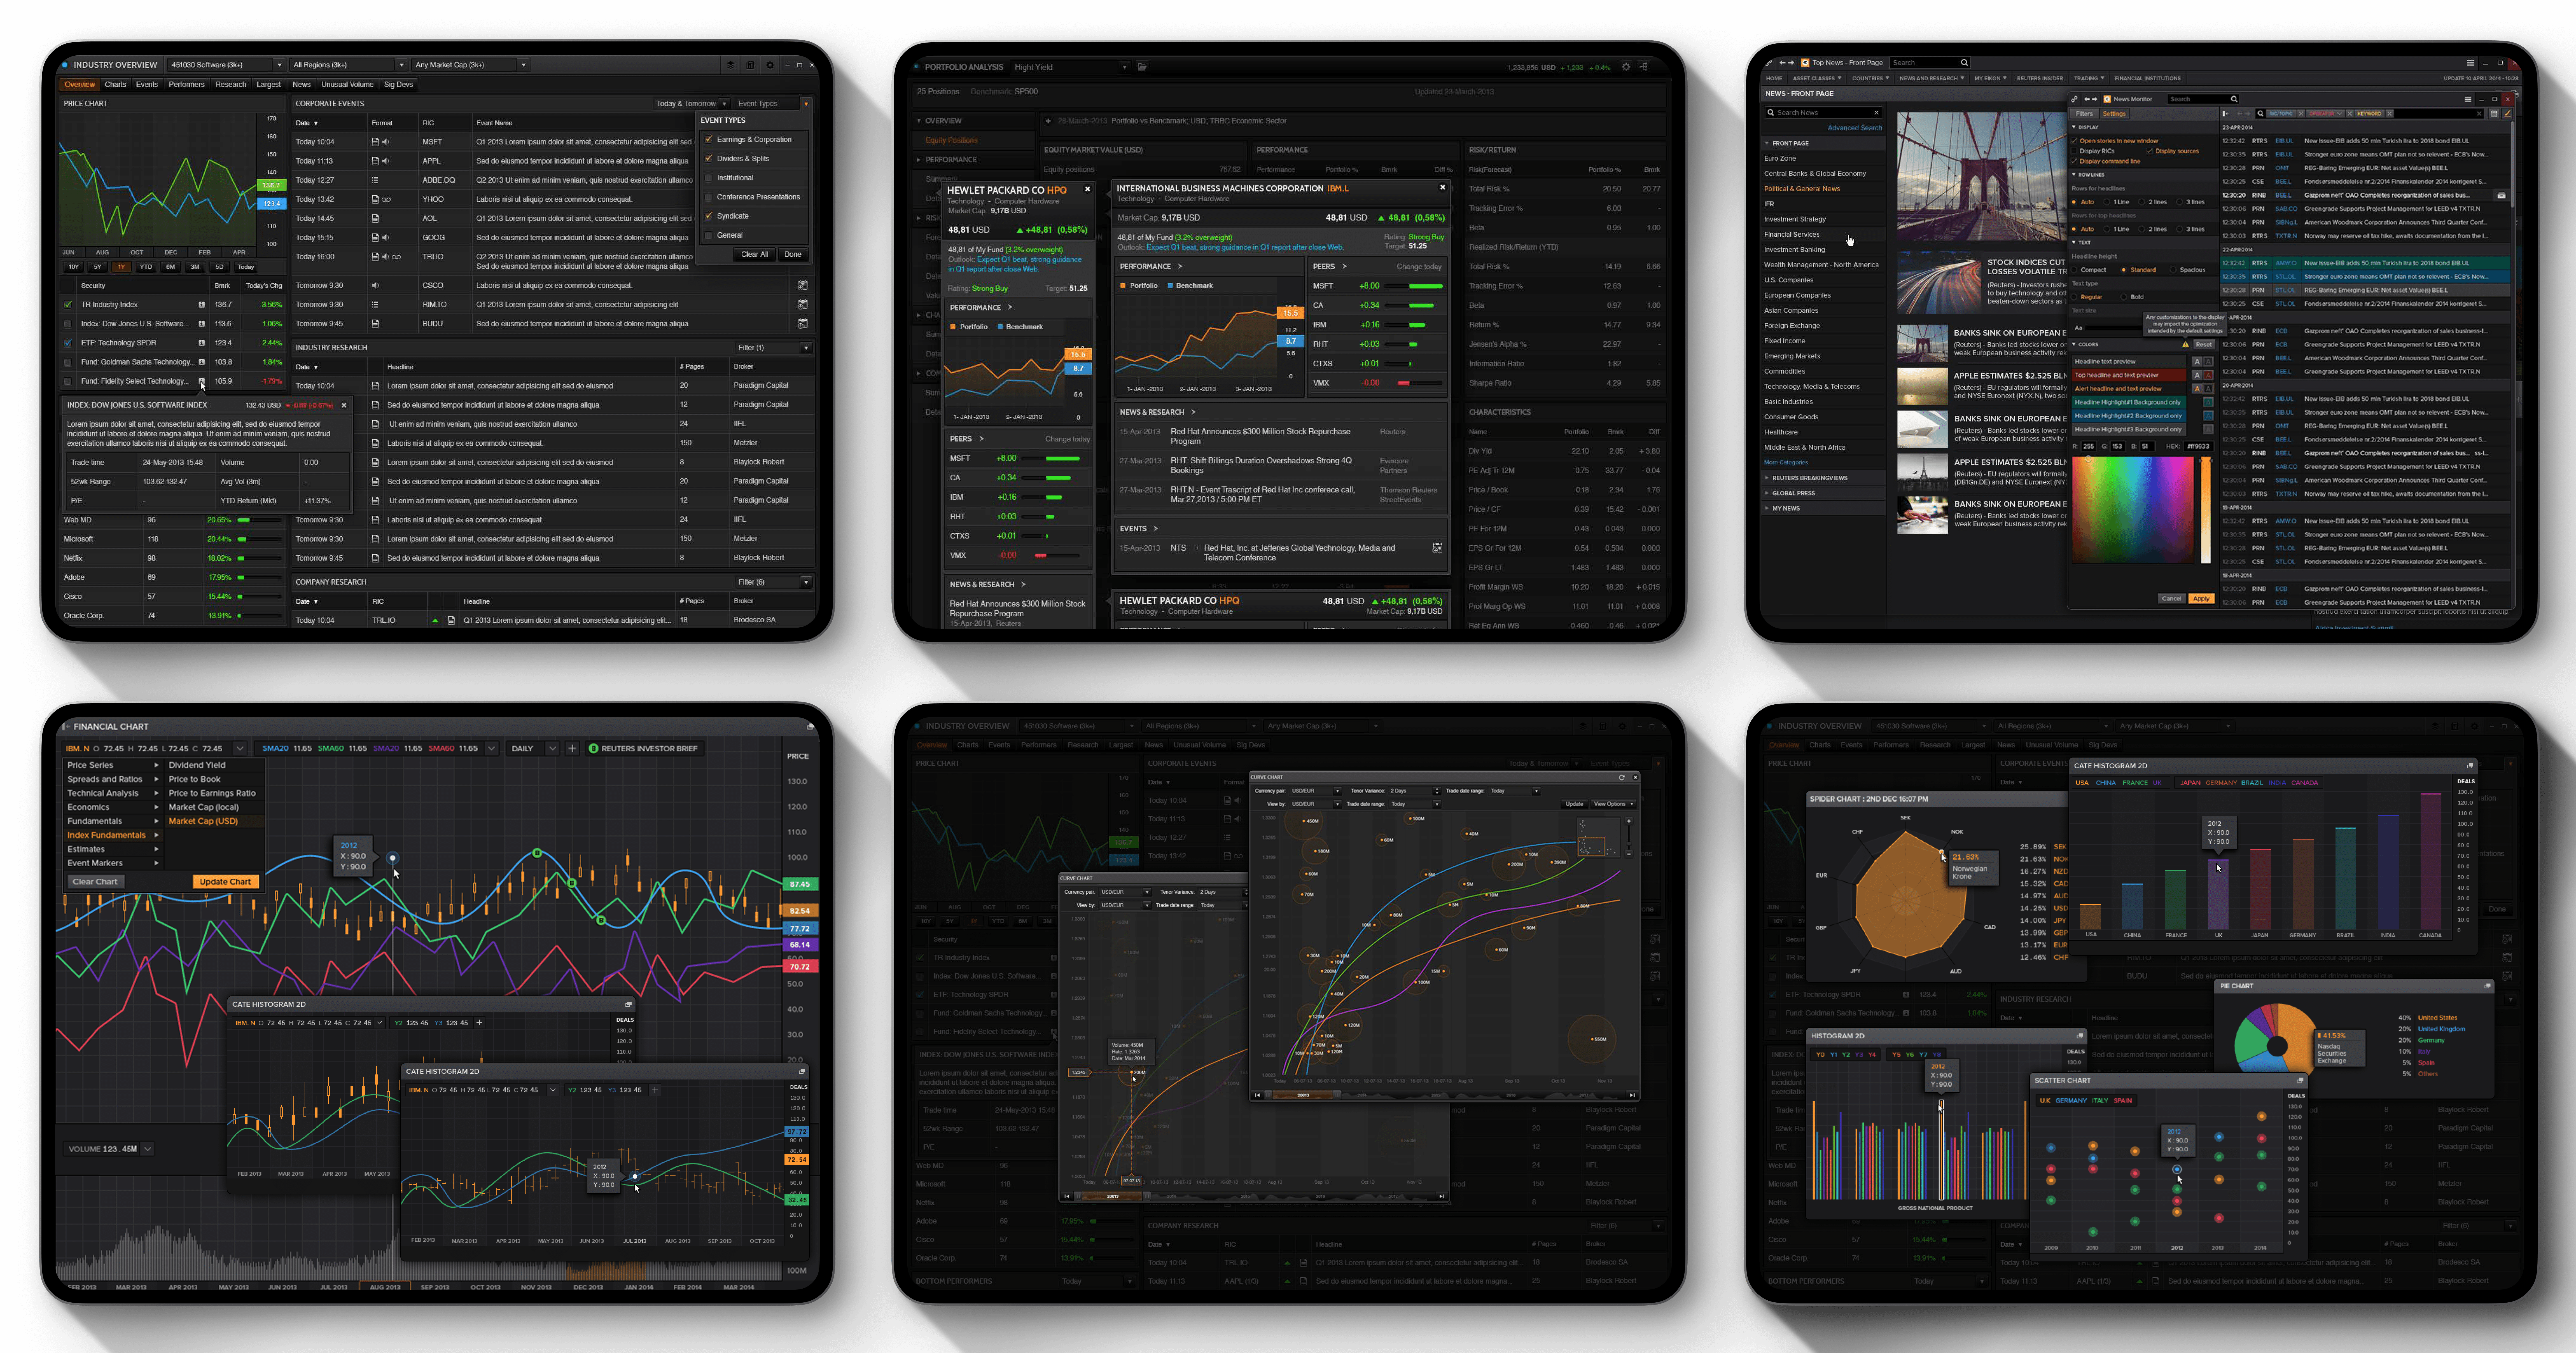
Industry overview
A broad snapshot of a specific industry: key companies, performance, themes, earnings, markets, and related data.

News monitor
Customizable news view that lets you track Reuters and other market news based on an instrument, portfolio, or search criteria. Enables to watch pertinent company and market news in one location. It is designed to be dynamic, so the stories change according to the active symbol or criteria you set.


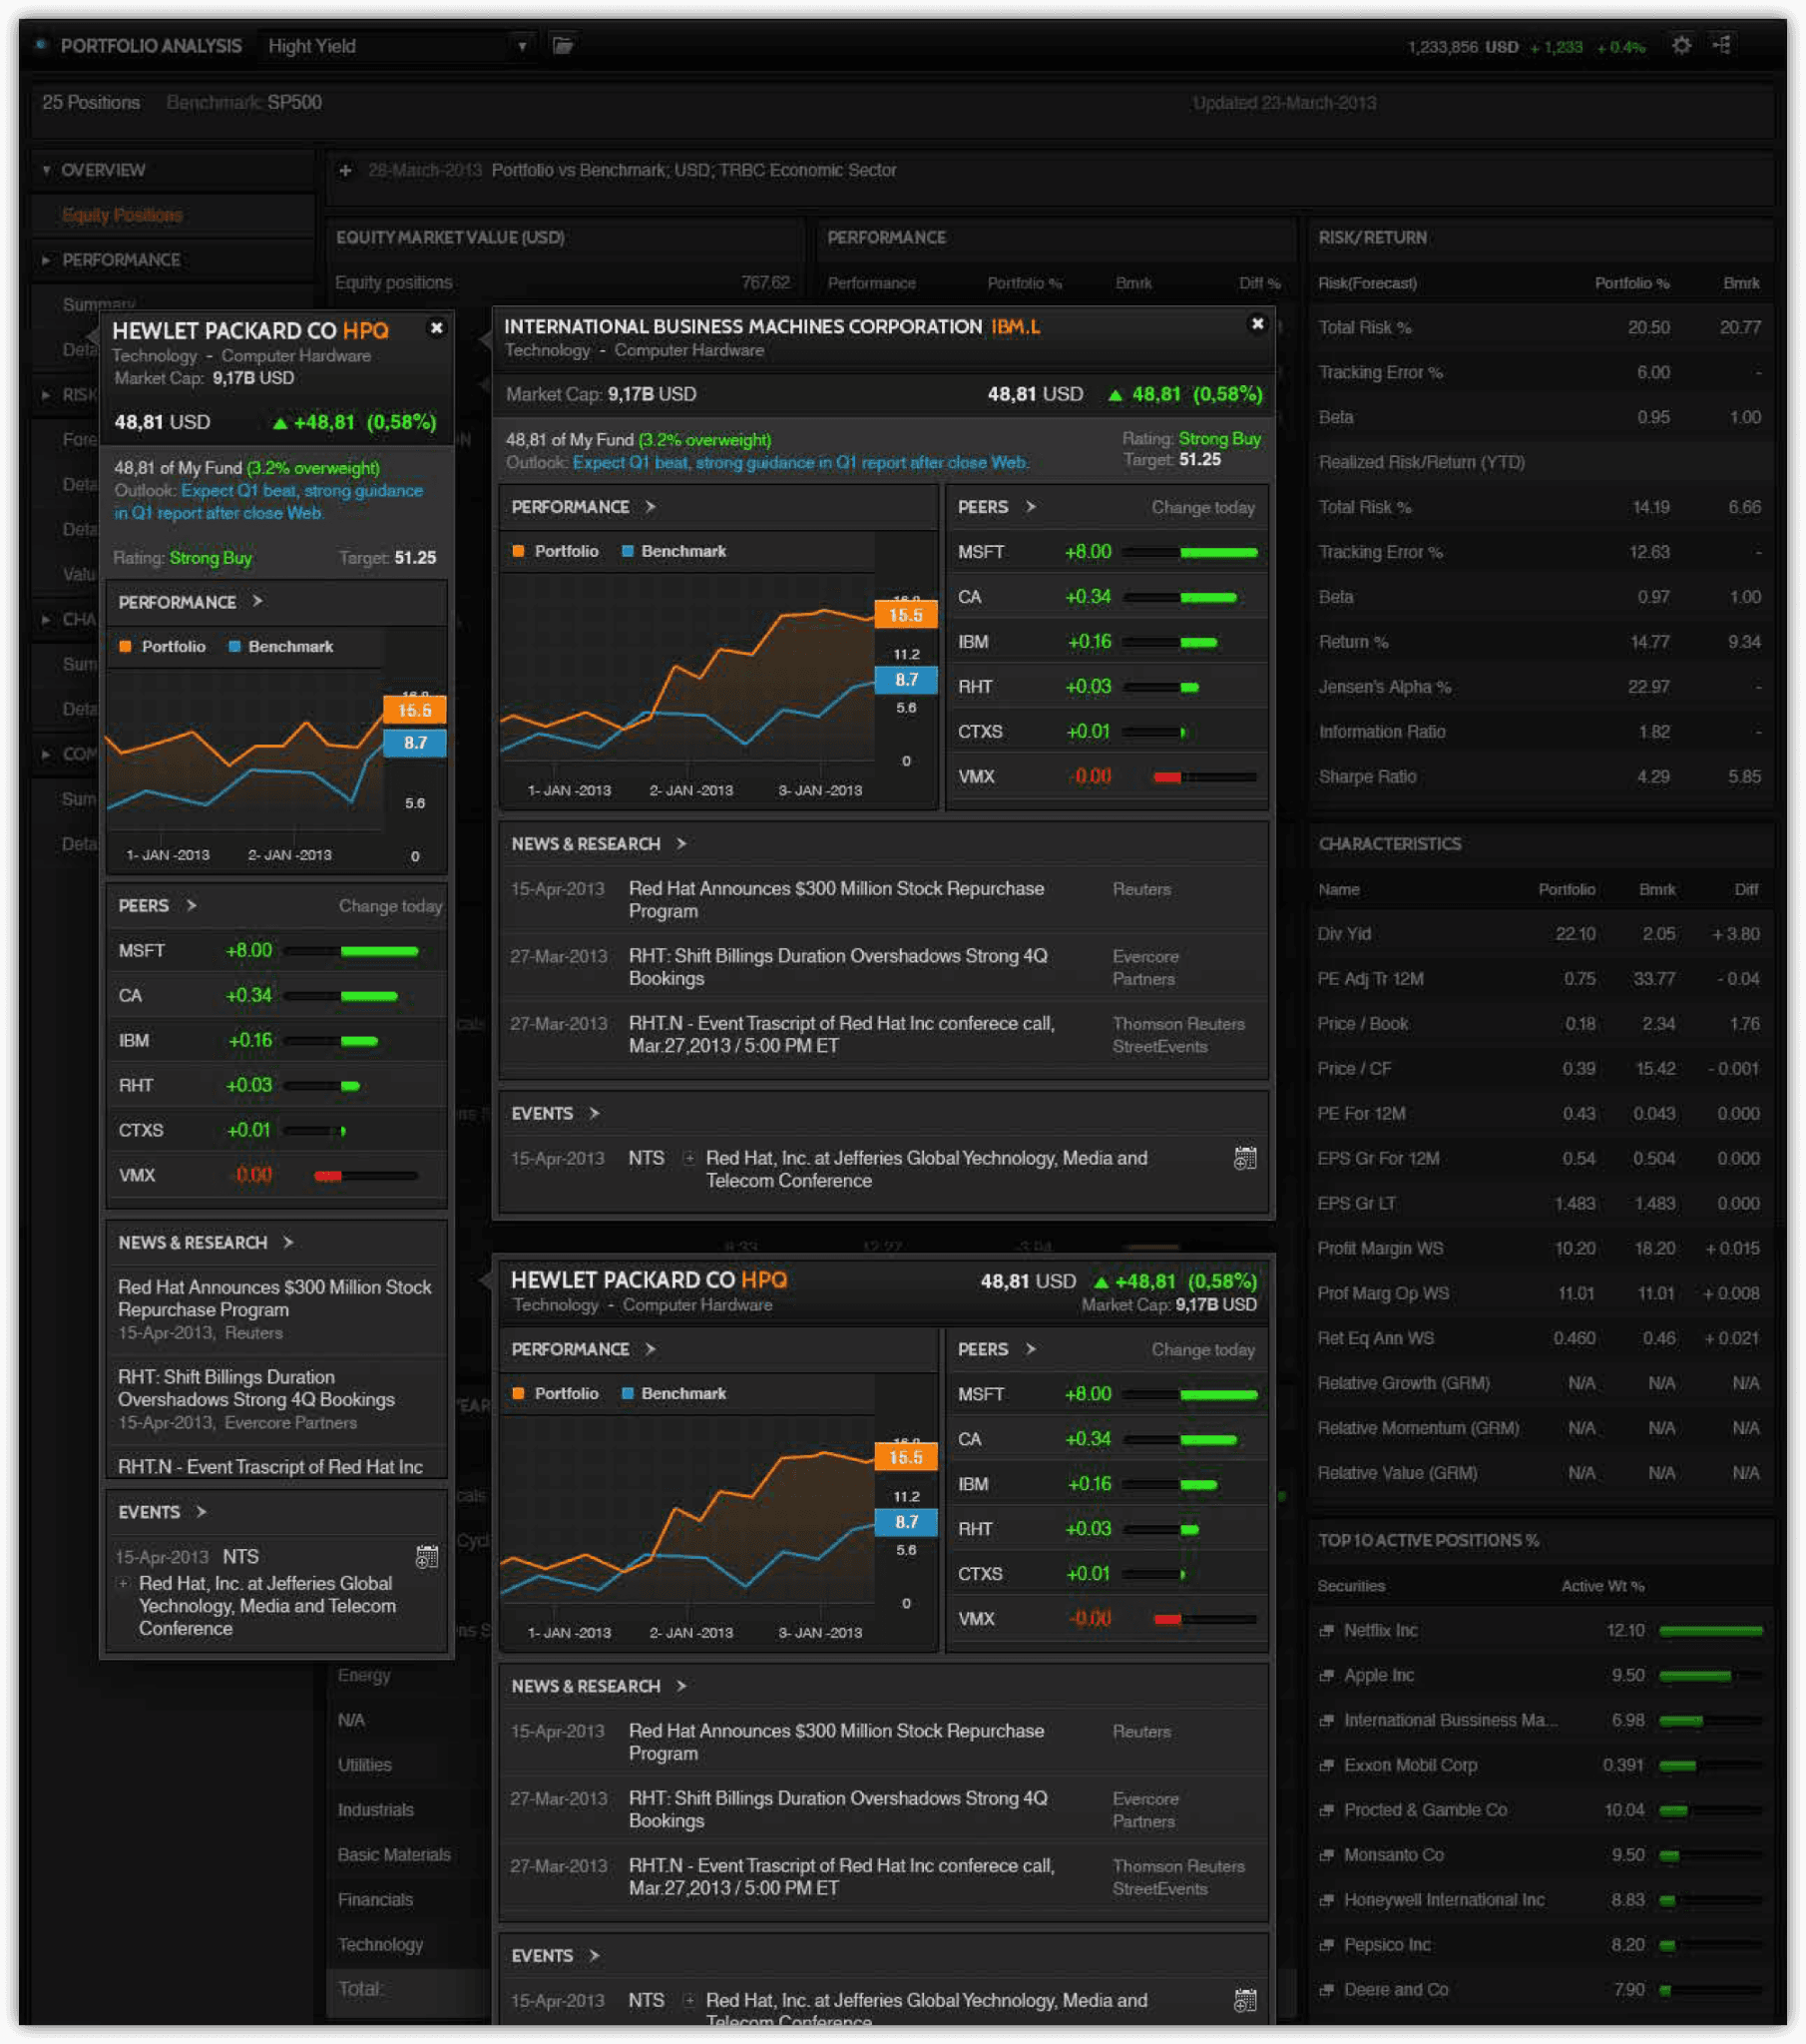
Portfolio analysis
A set of tools for tracking how a portfolio is performing and what is driving its risk and return. It lets users monitor market movements, run risk valuation and stress tests, and align portfolios with investment objectives. Helps portfolio managers and analysts see the impact of market changes on holdings and lists. It also supports attribution analysis, risk metrics, and scenario analysis so you can understand where performance comes from and where exposure sits.
Financial chart
View and analyse market data for financial instruments in a simple, cross-asset chart interface. It lets plot prices and apply analysis tools such as technical indicators, comparisons, and other chart studies.




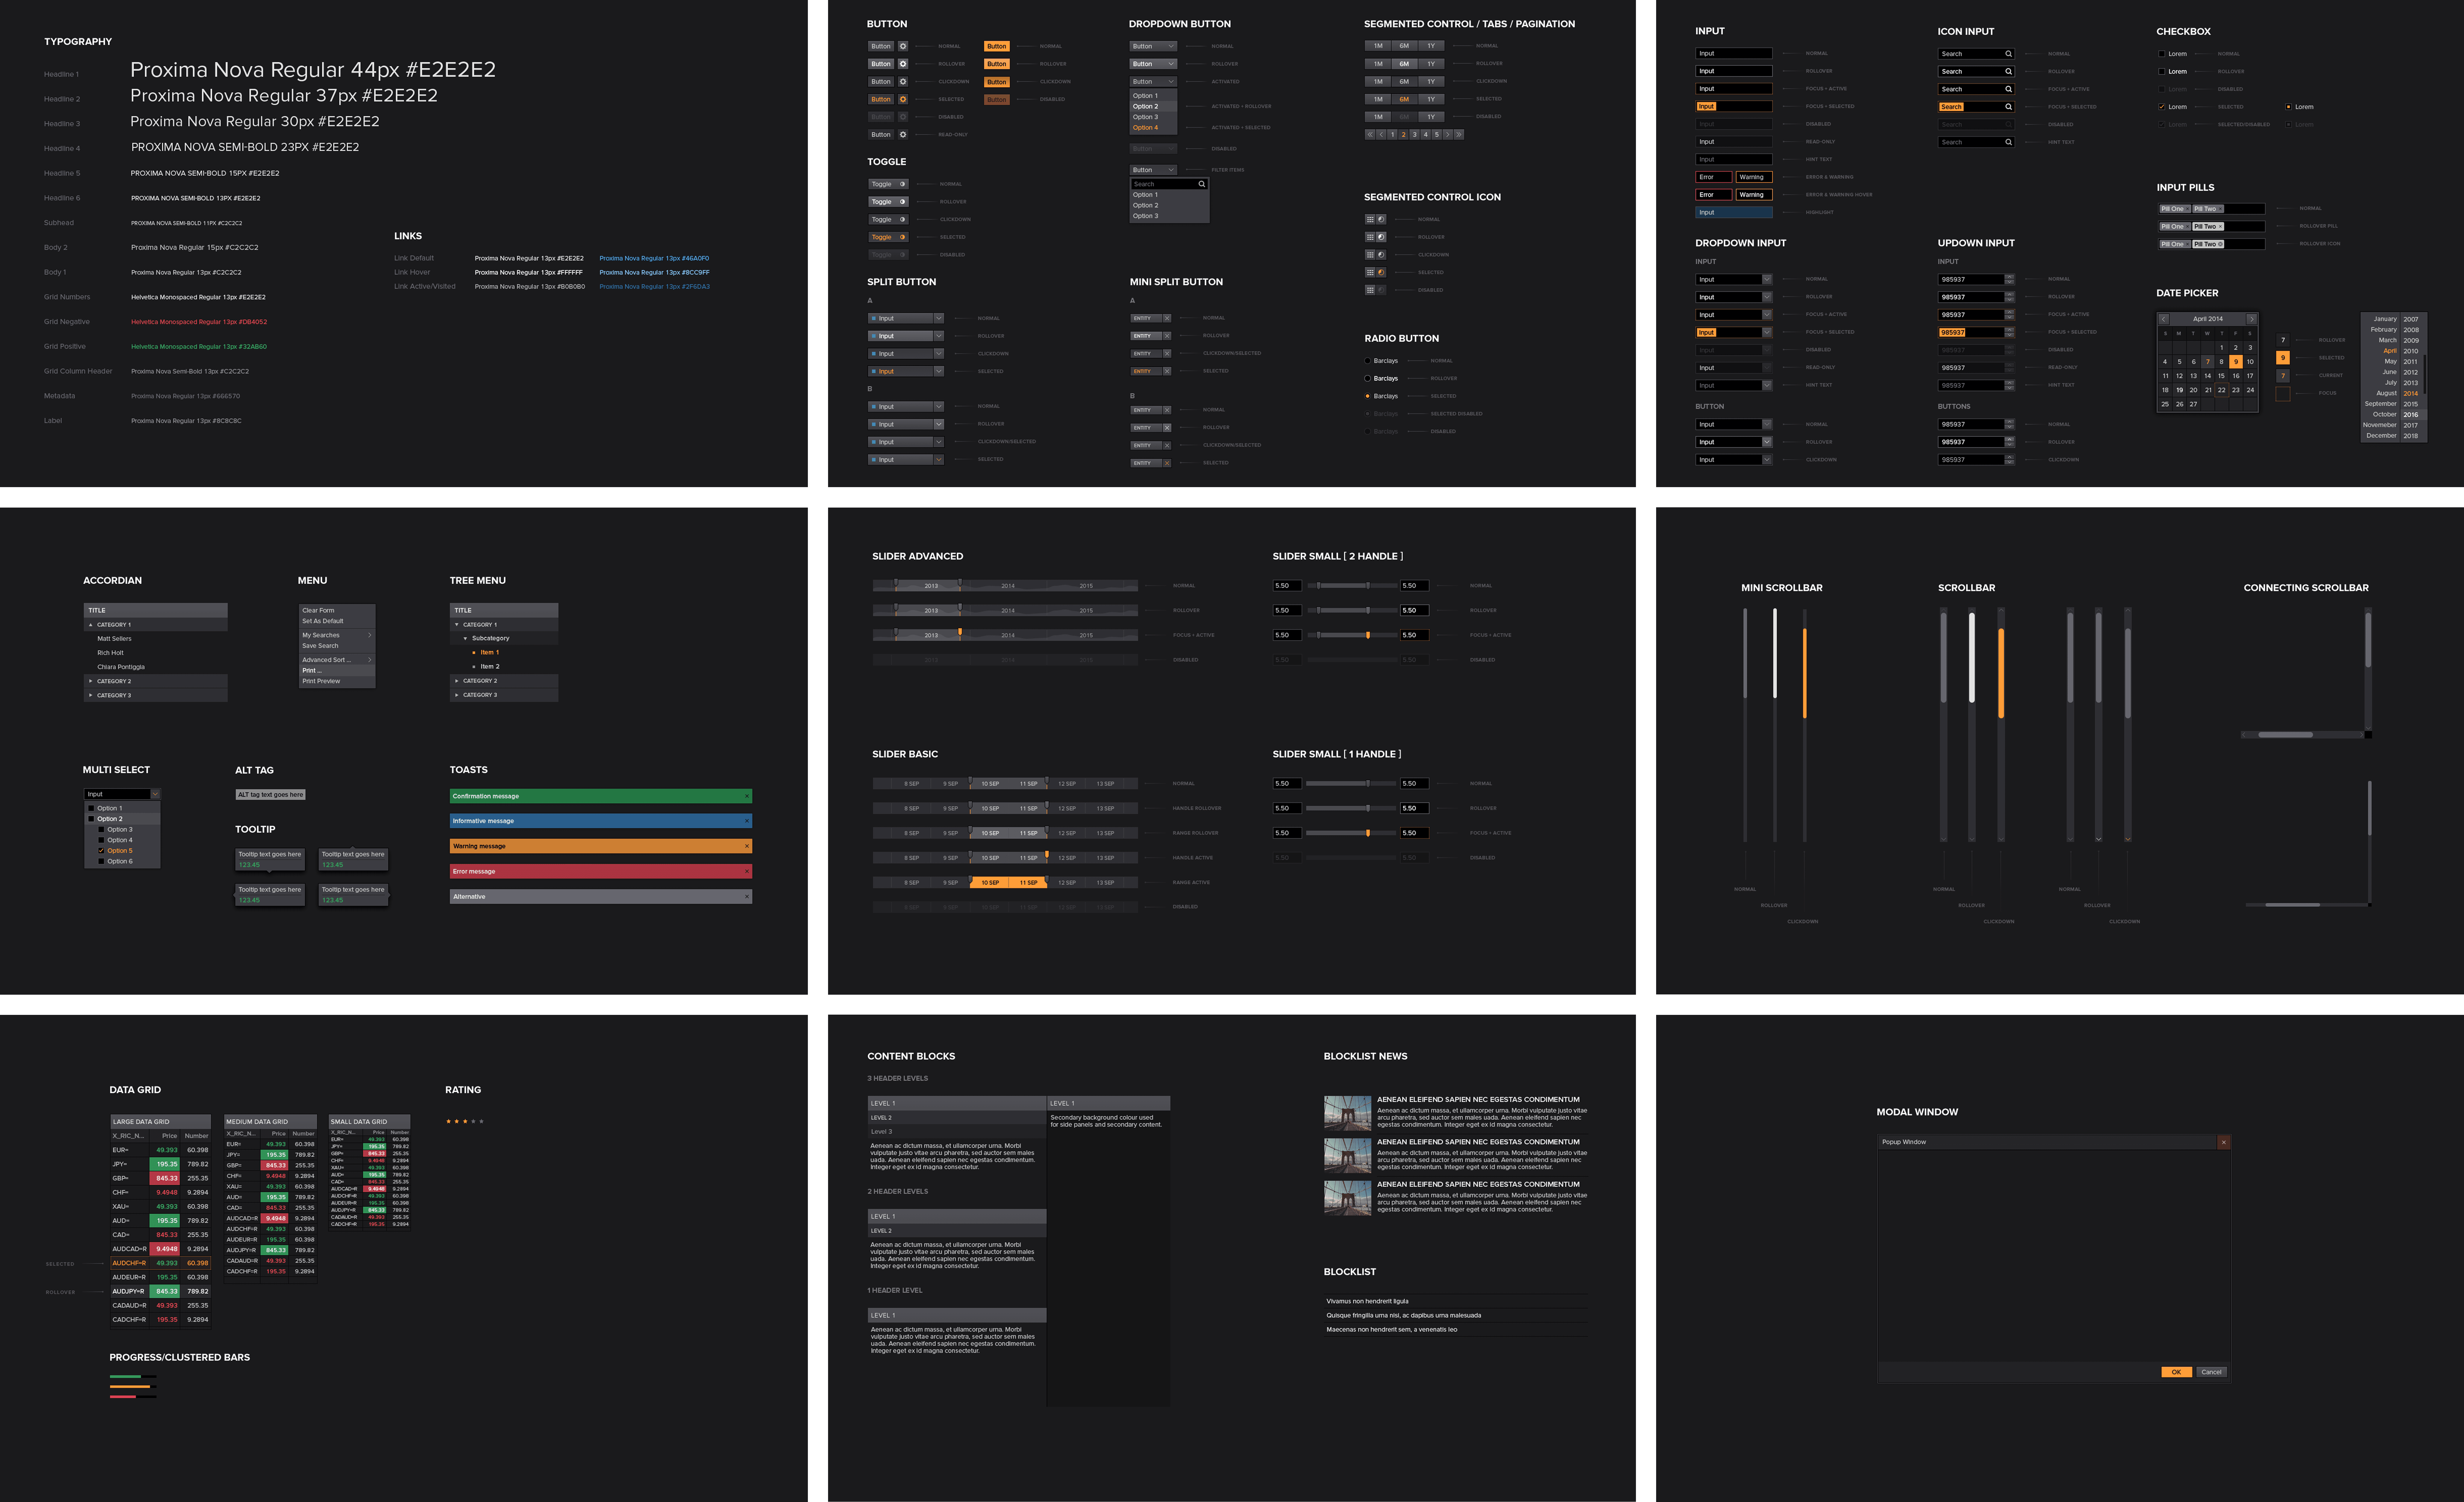
Design system