background
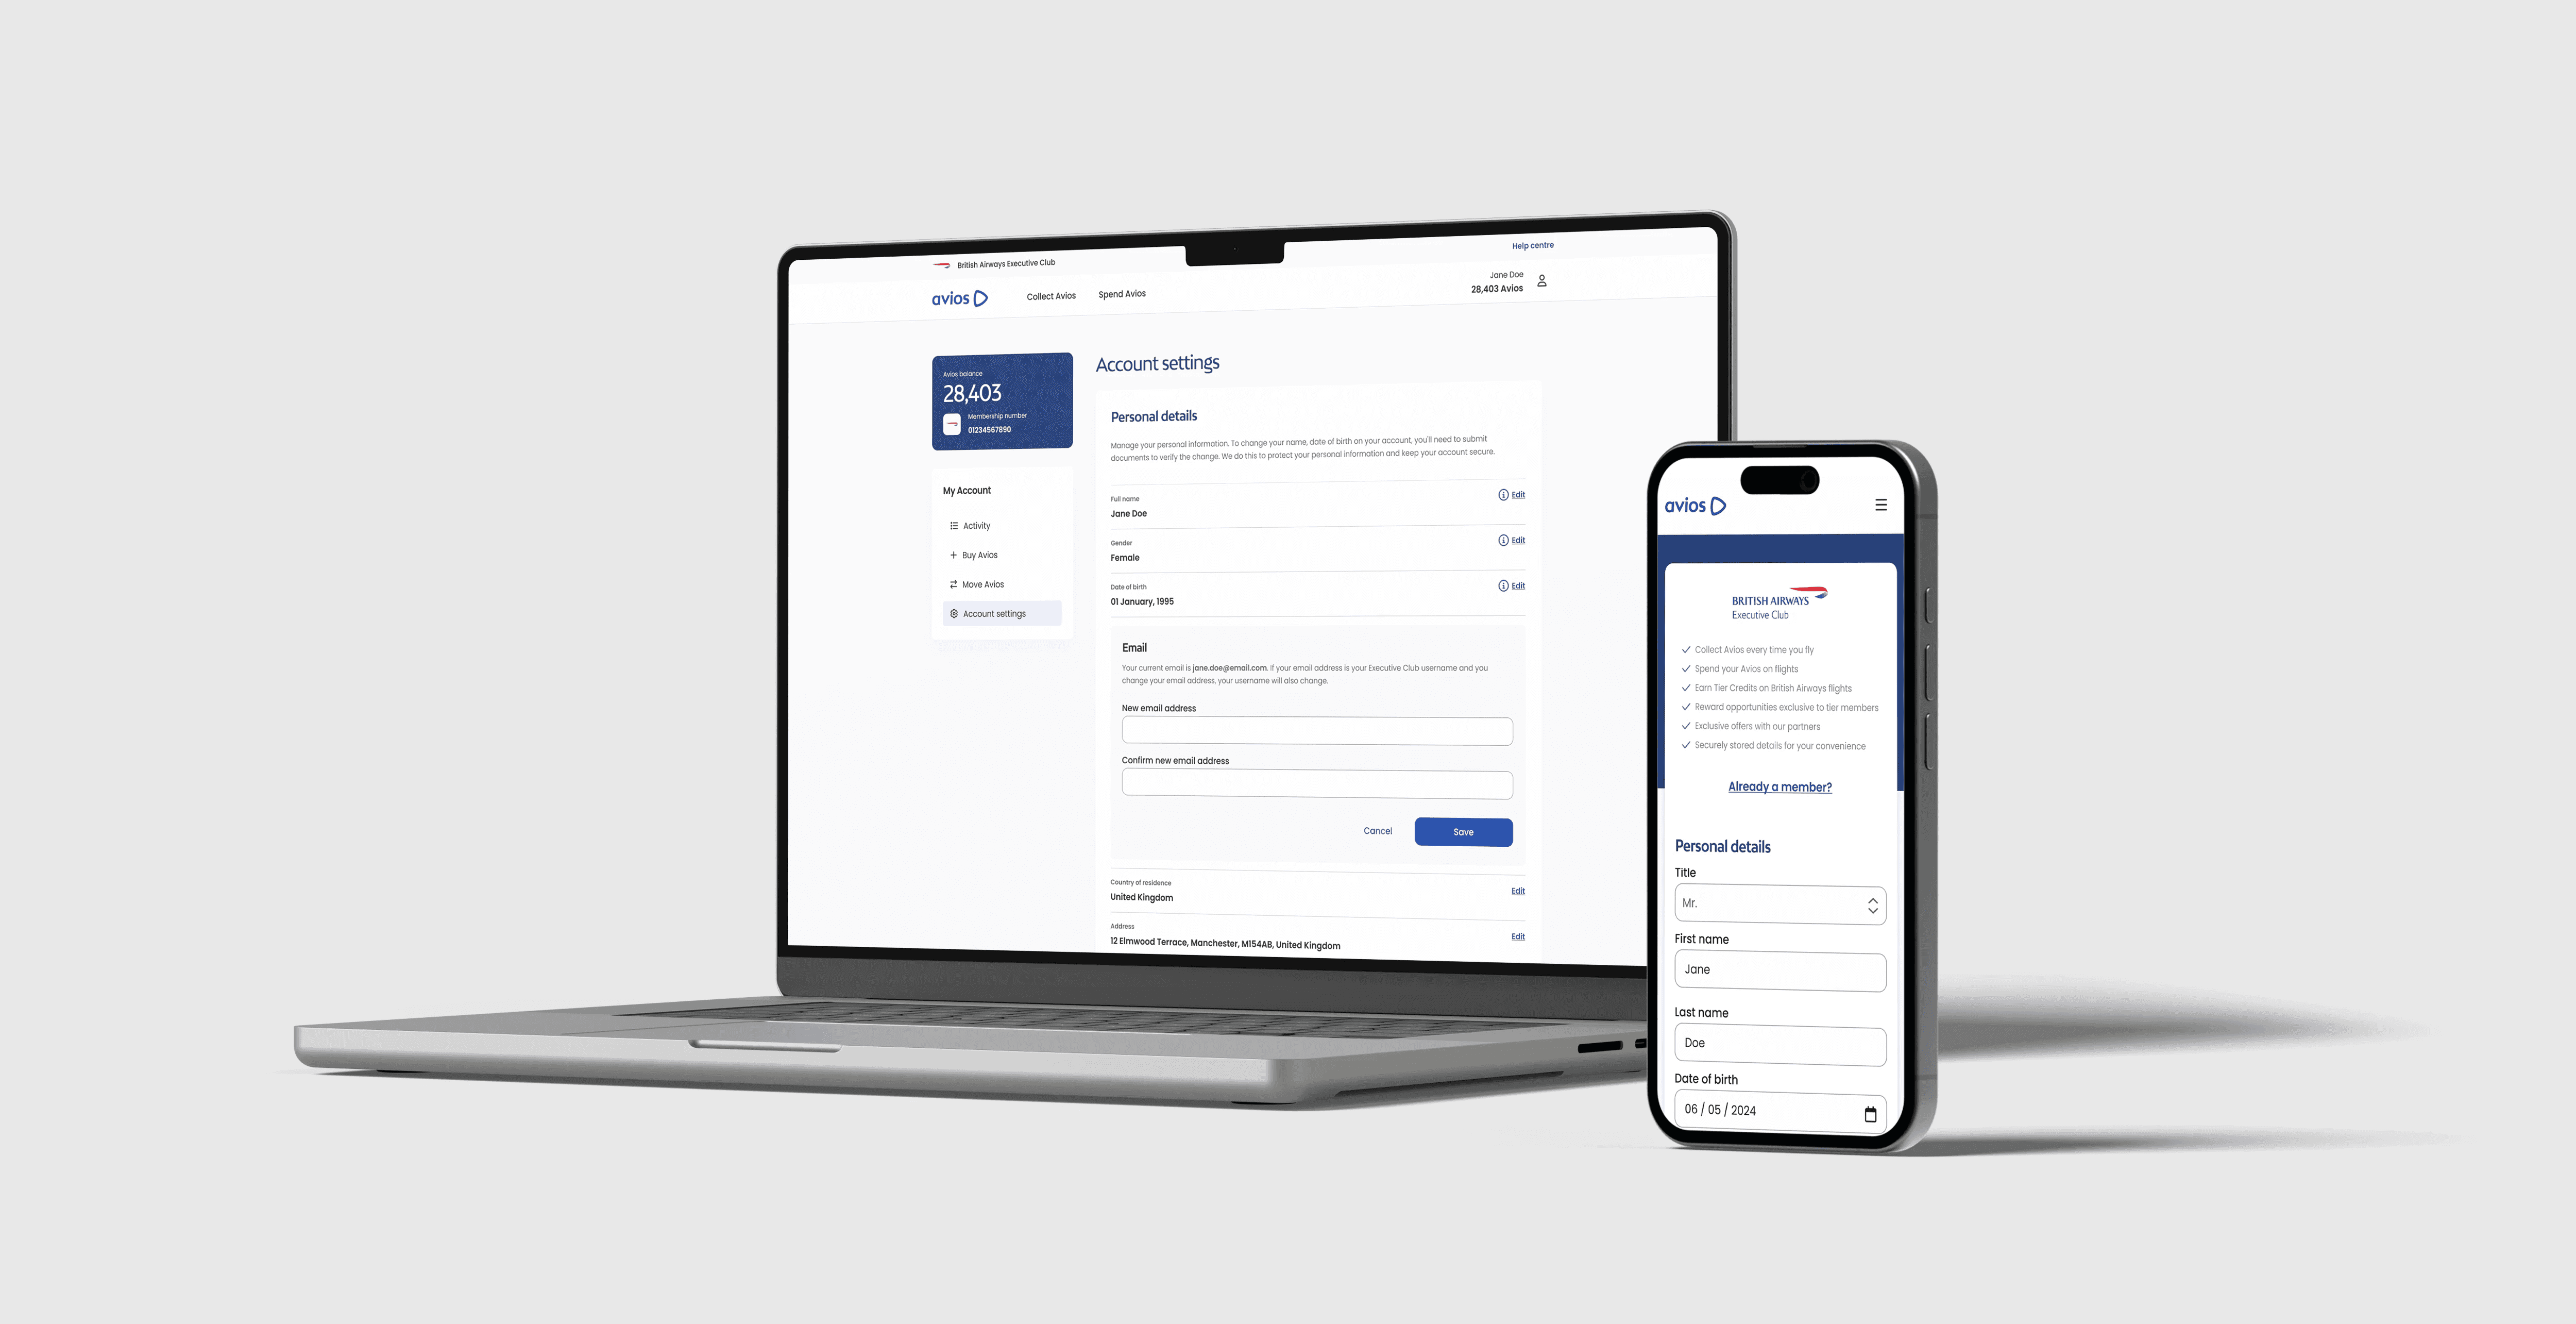
Starkdata, a startup company, requested a complete visual design for a B2B SaaS platform. This software manages the customer lifecycle for any retail organisations focused on optimising and amplifying sales, marketing, and customer service operations to foster stronger relationships and communication strategies across all stages of the customer journey.
Artificial intelligence (AI) and machine learning (ML) are used to identify customer behaviour patterns, which are important indicators of the churn rates. As a result, company's groups can undertake a proactive approach in their efforts to improve and increase customer retention and loyalty. As a result, generate a more solid and consistent revenue at lower prices.
challenge
Design a data-driven visual strategy and create a complex set of elements powered by artificial intelligence and machine learning.
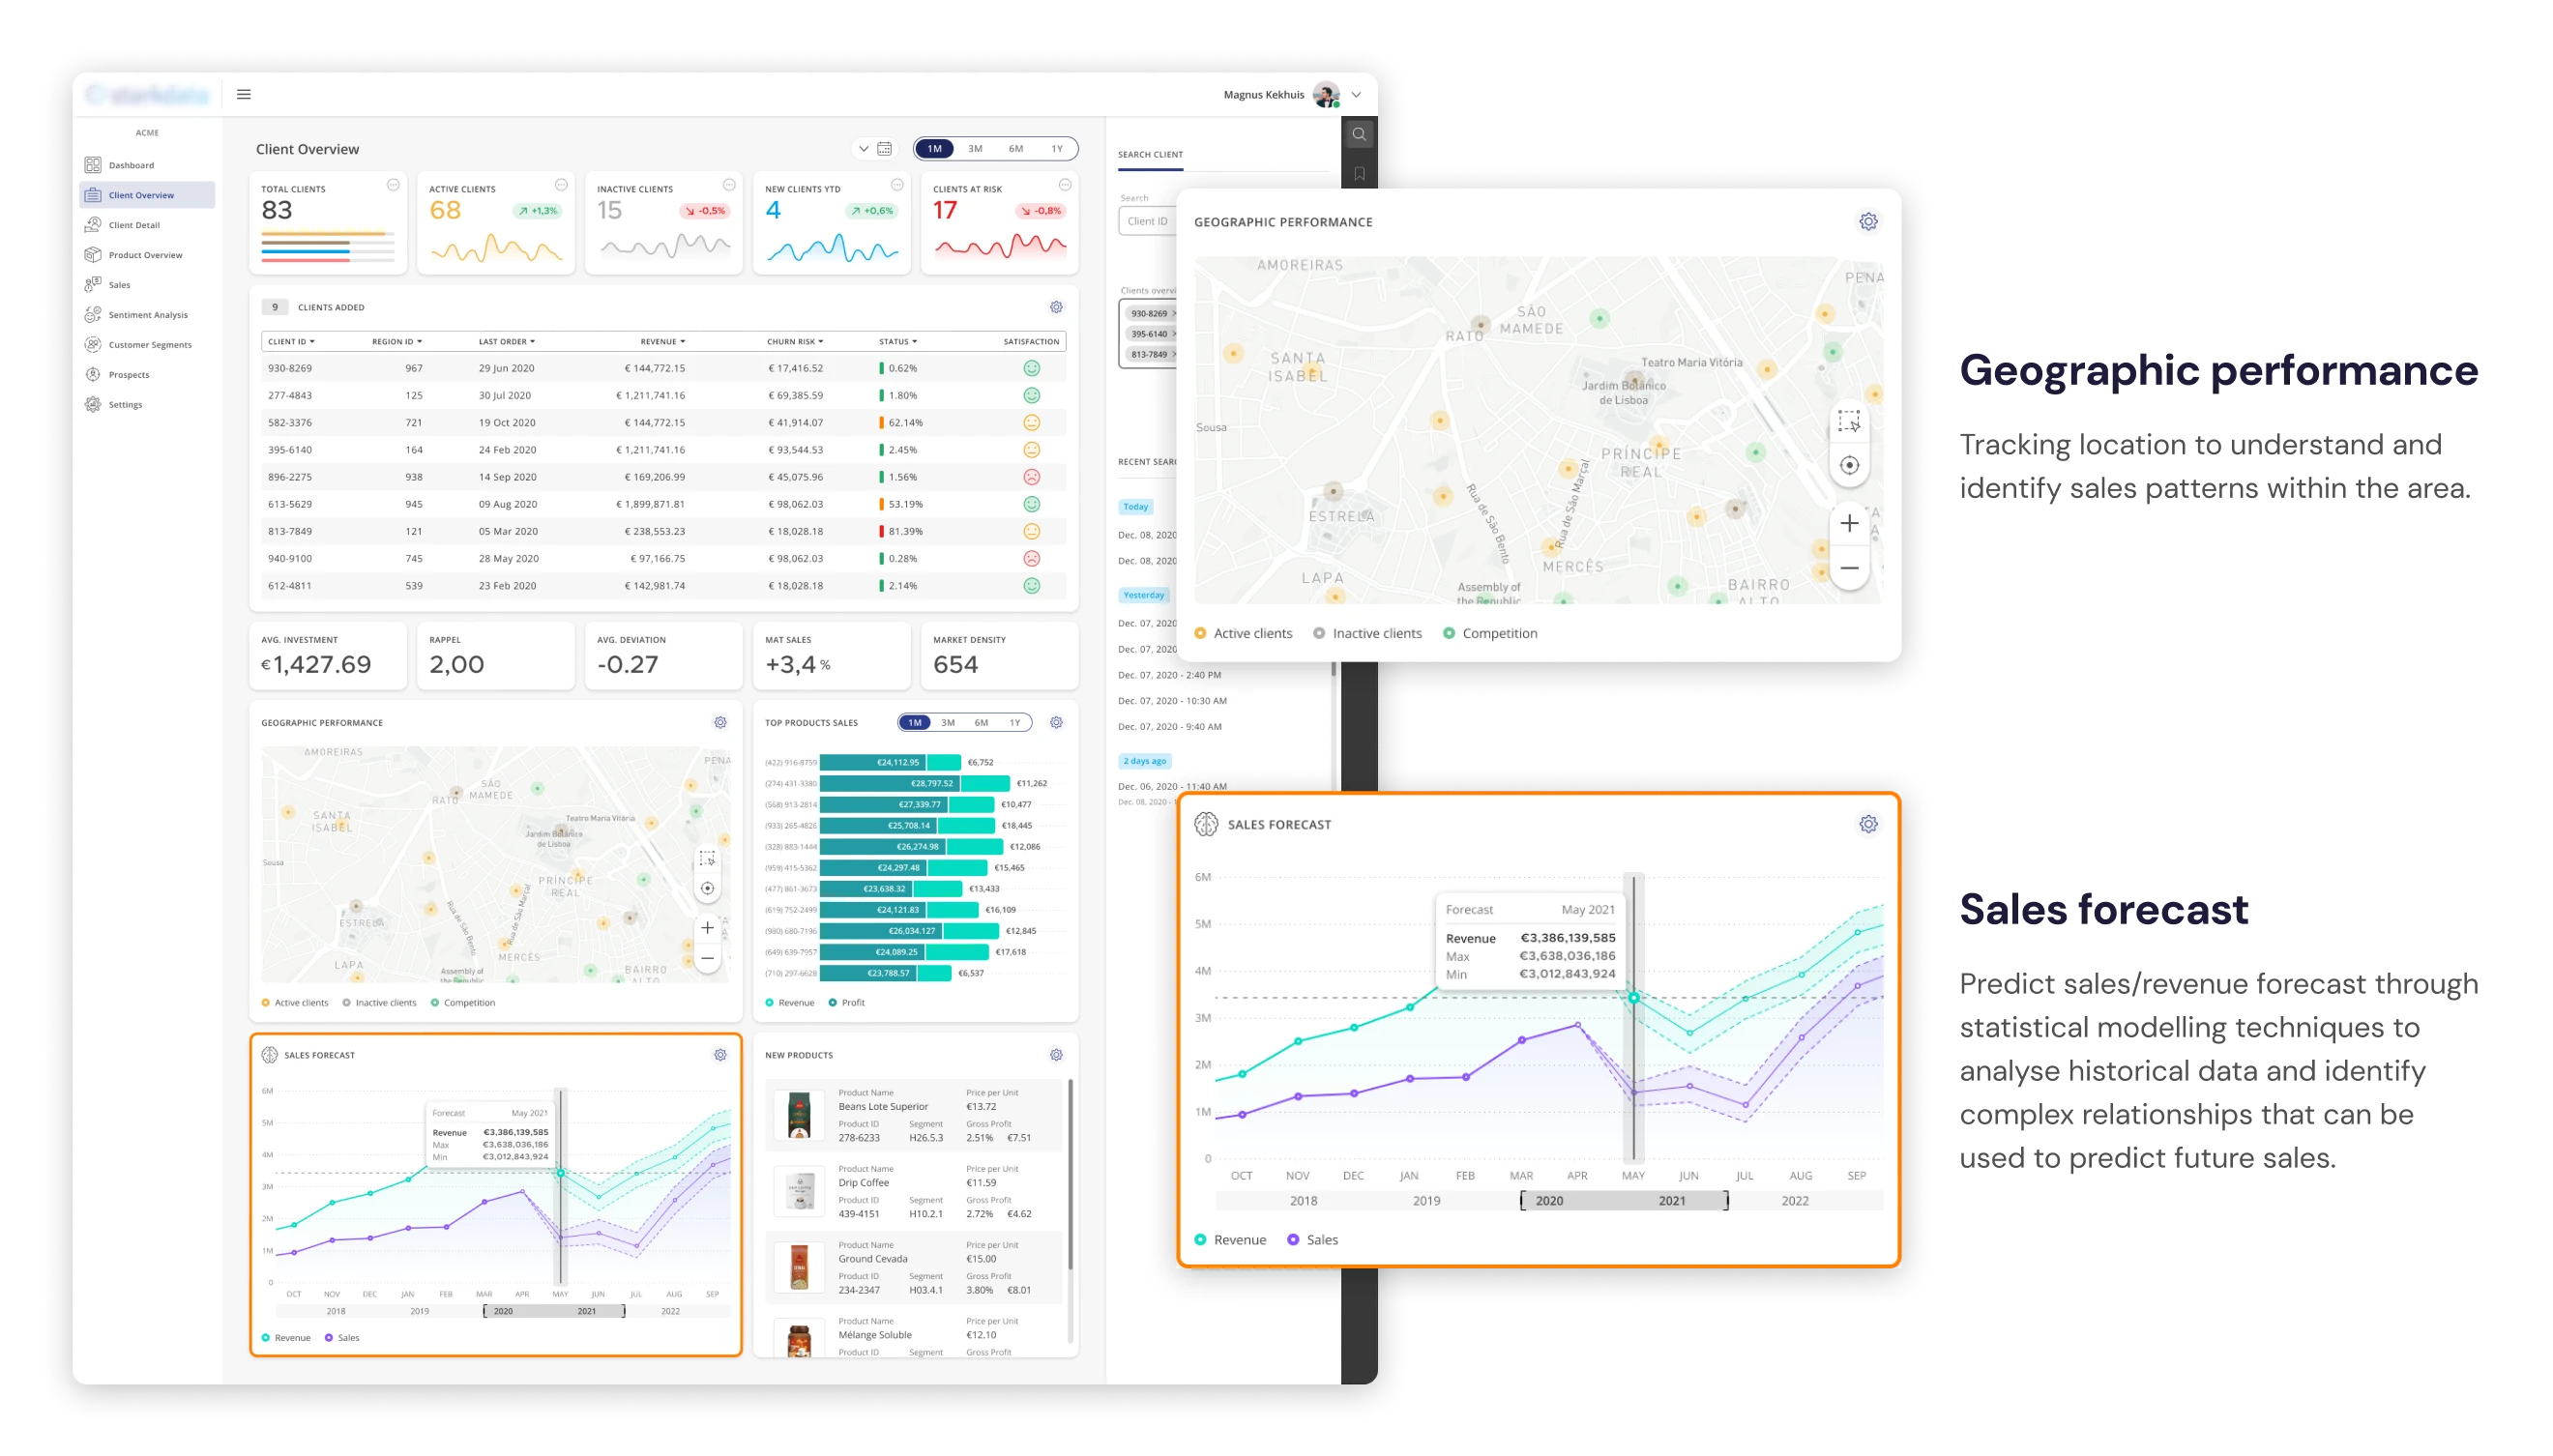
Analyse the data and create a comprehensive, user-oriented visualisation that effectively communicates key insights.
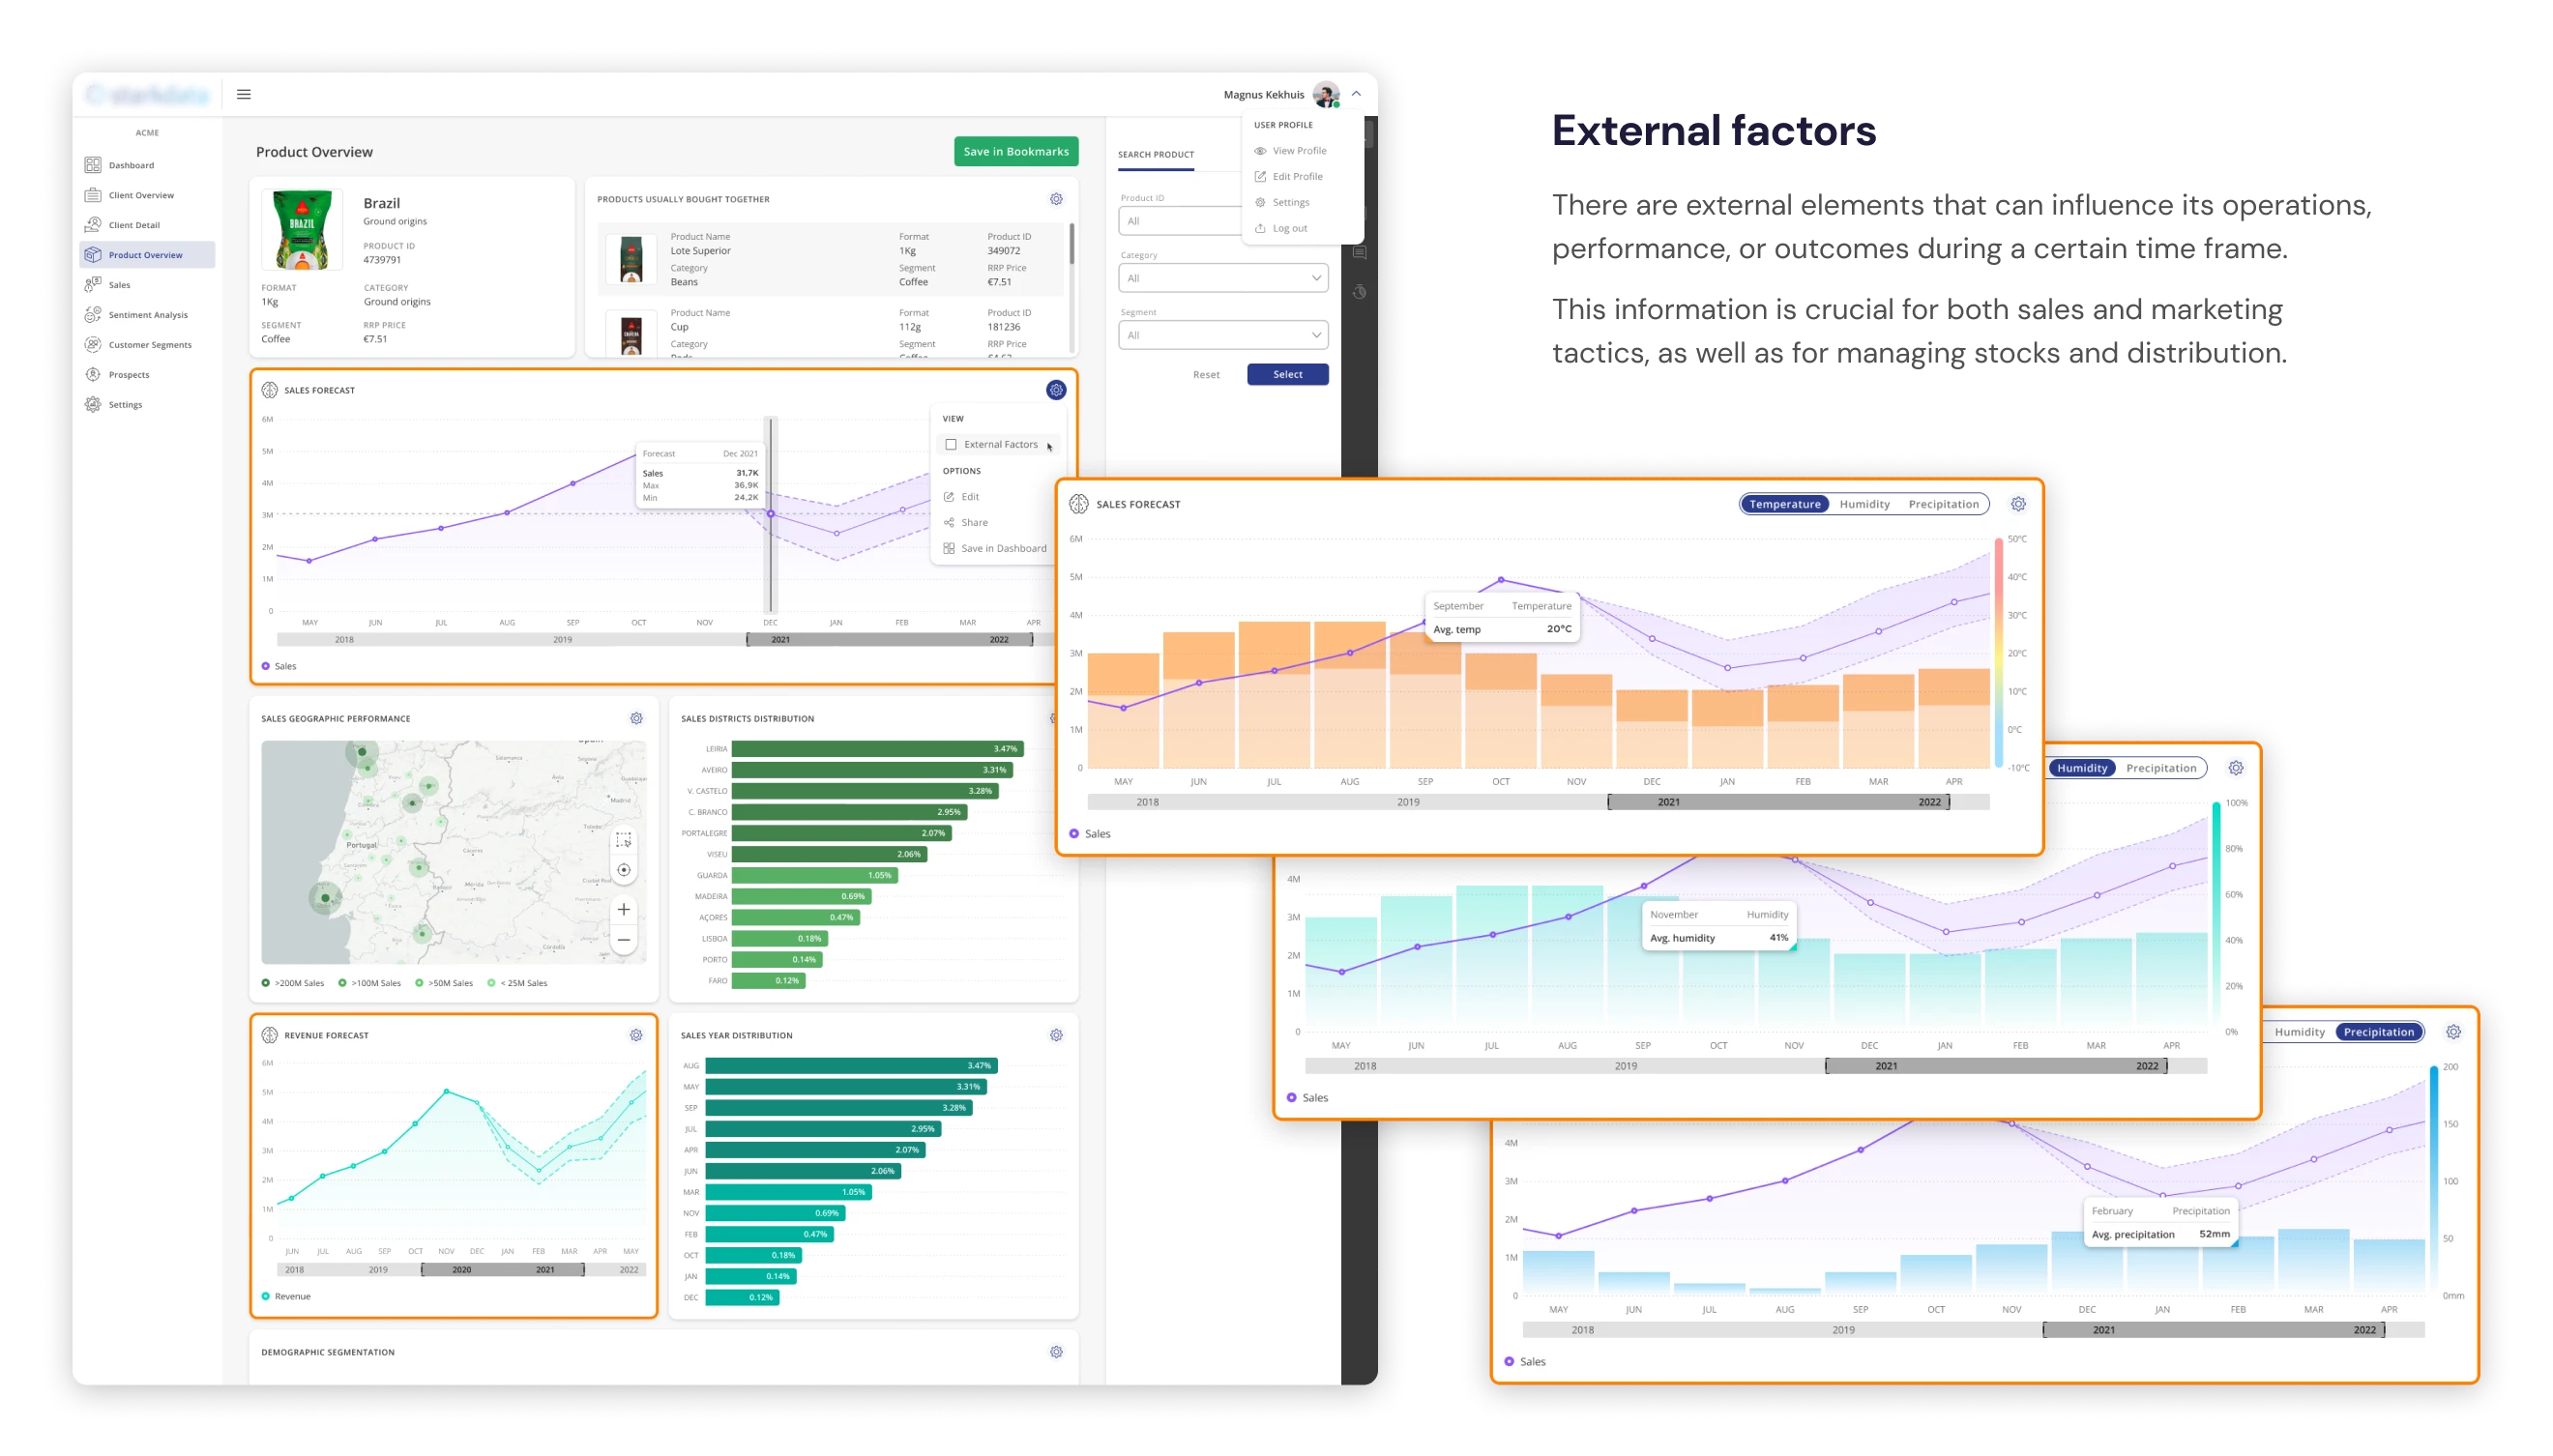
Create flexible space environments that can be customised to meet the specific requirements of retail, banking, or healthcare businesses, accommodating varying market trends and content diversity.
Design a seamless digital experience by developing high-fidelity mock-ups, user flows, and a cohesive design system.
Design Process
Goal
The primary objective at this early stage was to display the data in a manner that eliminates any user potential frustrations and obstacles that may prevent their comprehension. Provide them with the tools and essential information at various stages of their journey to achieve their objectives with greater proactivity.
Planning
Our primary strategy to reduce customer churn relies heavily on data, and it is within this data that we faced the most enduring challenge in this project. Data and its importance are what we focus on to identify key metrics and build a model that predicts outcomes. As a result, data visualizations must be straightforward to comprehend, highlighting essential details and crucial insights, and minimizing overload of information.
user personas
In order to gain a deeper understanding and empathy for our user target, was created 3 main user personas based on the research findings from our stakeholders and retail clients. This enabled me to step into their shoes, imagining their daily routines, challenges, and aspirations, to ensure a user-centred design process.
Data visualisation
Data literacy is essential for understanding different types of data and their characteristics, concepts, and techniques. In order to apply critical thinking and effective communication, it is crucial to identify potential biases in data collection to effectively communicate insights to different audiences by employing appropriate language and data visualisations.


Results
Recognizing the budget limitations typical of early-stage startups, we adopted a streamlined, collaborative design approach. We bypassed formal usability testing, instead engaging directly with stakeholders and early clients in brainstorming sessions.
This project, though resource-constrained, proved to be an invaluable learning experience and ultimately resulted in a successful product delivery.